Reftab has a powerful report builder that allows you to build custom queries to find specific data about your asset inventory. For example, if you need to look at a specific date range and display all the items that were checked out, you can do so.
To start, log into your Reftab account and click, “Reports” > “New Report“

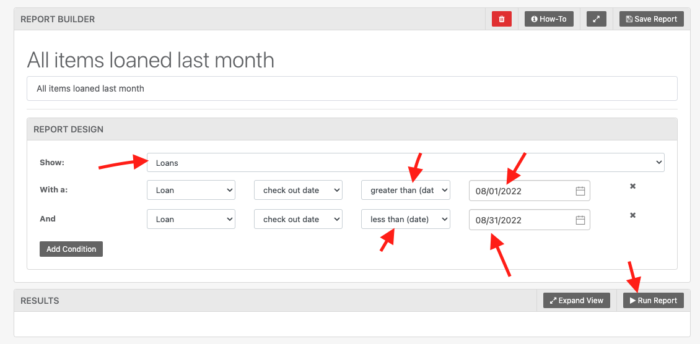
Then, give your report a name and build your report as seen in the screenshot below. You’ll specifically want to run a “Loans” report looking at loan check out date between two dates:

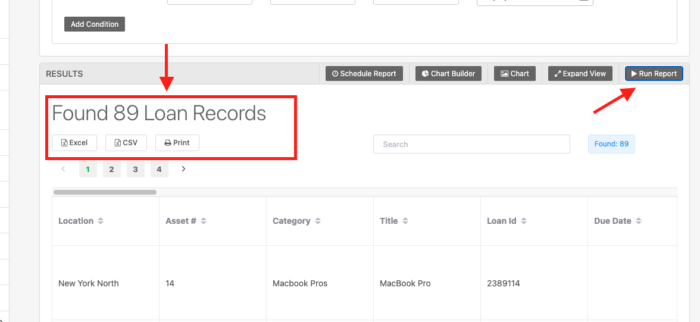
In the above screenshot, the report is searching for loaned items checked out between August 1, 2022 and August 31st, 2022. Click “Run Report” and you’ll see the results which you can download to Excel.

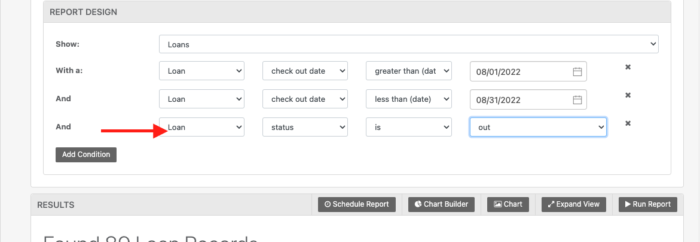
You can continue to click “Add Condition” if you want to add more conditions to filter upon. For example, if you wanted to see items that are still checked out, you can click “Add Condition” and add a row “and loan status is out”

You can even schedule the report or build charts to group items by category or location and display counts of how many items within.
For assistance, email ‘help@reftab.com’